A page can feel quick when opened from a bookmark and sluggish when reached from inside an app. Testing only the bookmark leaves half the story off the clipboard. For a single-page application, record the route the person actually takes, then compare it with a direct load of the same destination.
Chrome's October DevTools recap, published September 22, 2026, reports soft-navigation analysis in the Performance panel’s Insights, alongside the existing Live Metrics and trace views. That makes a route-by-route review worth adding to a release check. It does not make one local recording a measure of all your users.

Start with a transition, not a score
Chrome's soft-navigation documentation, updated September 2, 2026, describes detection around a user action, a visible URL change and a visible paint. It says the feature is enabled by default from Chrome 151. Browser detection can still differ from what a person considers a new page.
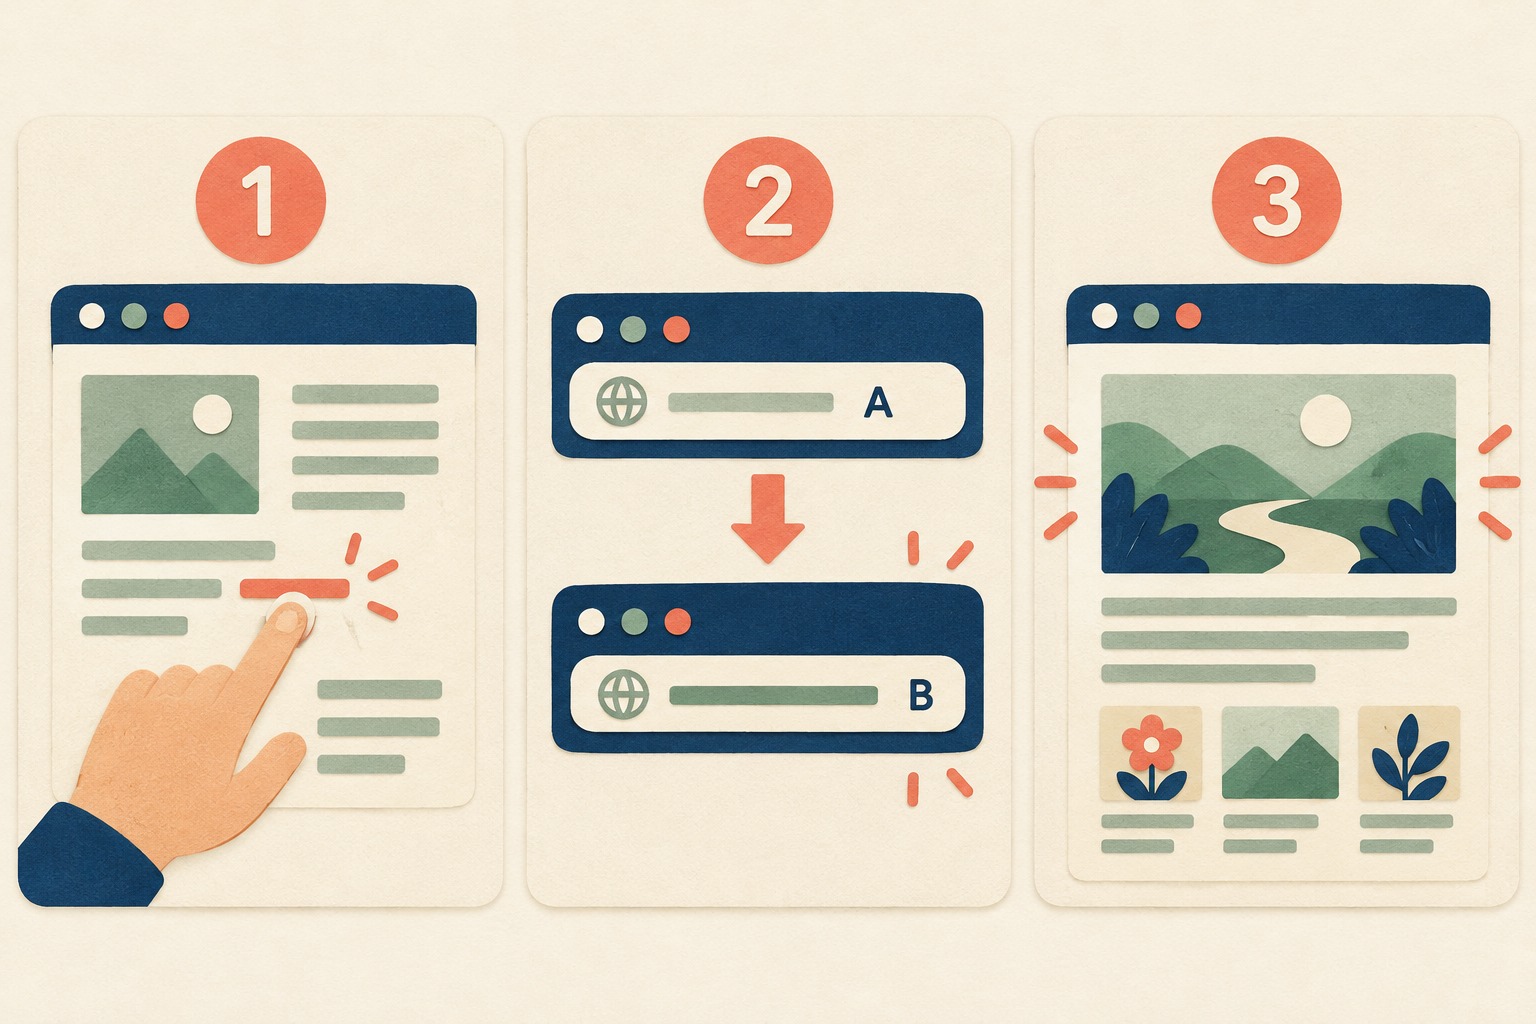
Our review method begins with a sentence: “From the results list, choose one item and wait until its detail view is usable.” Replace that with a real task in your app. Use a non-production test account and harmless sample content where possible. Do not record a purchase, deletion or other consequential action merely to obtain a trace.
- Write the starting route and destination route.
- Name the exact control to activate, not just “navigate.”
- Describe the expected visible result: for example, a heading and the first details card.
- Choose one observation that would count as a problem, such as a blank content area after the URL changes.
This task description is an editorial testing aid, not a new definition of a browser metric.
Make two separate recordings
The official Performance panel guide explains how to record page loads and runtime activity. For this comparison, keep those two recording types separate: one for opening the destination directly, another for the click that reaches it inside the app.
- Direct route: open the destination URL with a controlled starting state. Record a page load. Note whether this was a fresh or cached load; do not call it “cold” without controlling that condition.
- In-app route: return to the written starting point. Start a runtime recording, perform the one planned action, wait for the expected content, then stop.
- Label before comparing: save each observation with its route type, browser version, app build and test conditions.
- Repeat consistently: repeat the same route under the same conditions. Keep unusual runs and explain them instead of quietly deleting the slowest one.
Use a small fixed repeat count chosen before testing, such as three runs per route, as an initial debugging sample. That is our suggested starting routine, not a statistically sufficient benchmark. If the spread is large, investigate the changing condition before declaring a winner.

Keep the destination and starting conditions together
| Record | Example entry | Why keep it? |
|---|---|---|
| Route | Results → sample item detail | A URL alone does not describe the path taken. |
| Build and browser | Build identifier; exact Chrome version | A later reviewer can identify the software under test. |
| Account and data state | Test account; fixed sample item | Different content can change the task. |
| Environment | Device; viewport; network and CPU settings | Do not compare unlike conditions as a code improvement. |
| Cache state | Observed or explicitly controlled; otherwise unknown | “First click” is not proof of an empty cache. |
| Visible outcome | Heading and details appeared; blank gap observed or not | The trace needs a connection to the actual task. |
These entries are illustrative fields, not results from testing a particular product. Keep account details generic in a shared report. A reproducible route does not require exposing a customer's records.
Do not subtract the wrong starting point
Chrome's documentation explains that performance timestamps remain relative to the original hard navigation. A soft-navigation loading duration therefore needs the matching soft-navigation start subtracted. It also warns that paint attribution needs the initiating interaction, rather than blindly relying on a paint entry's navigation ID. Use the documented API rules if implementing measurement; do not turn this worksheet into a replacement metrics library.
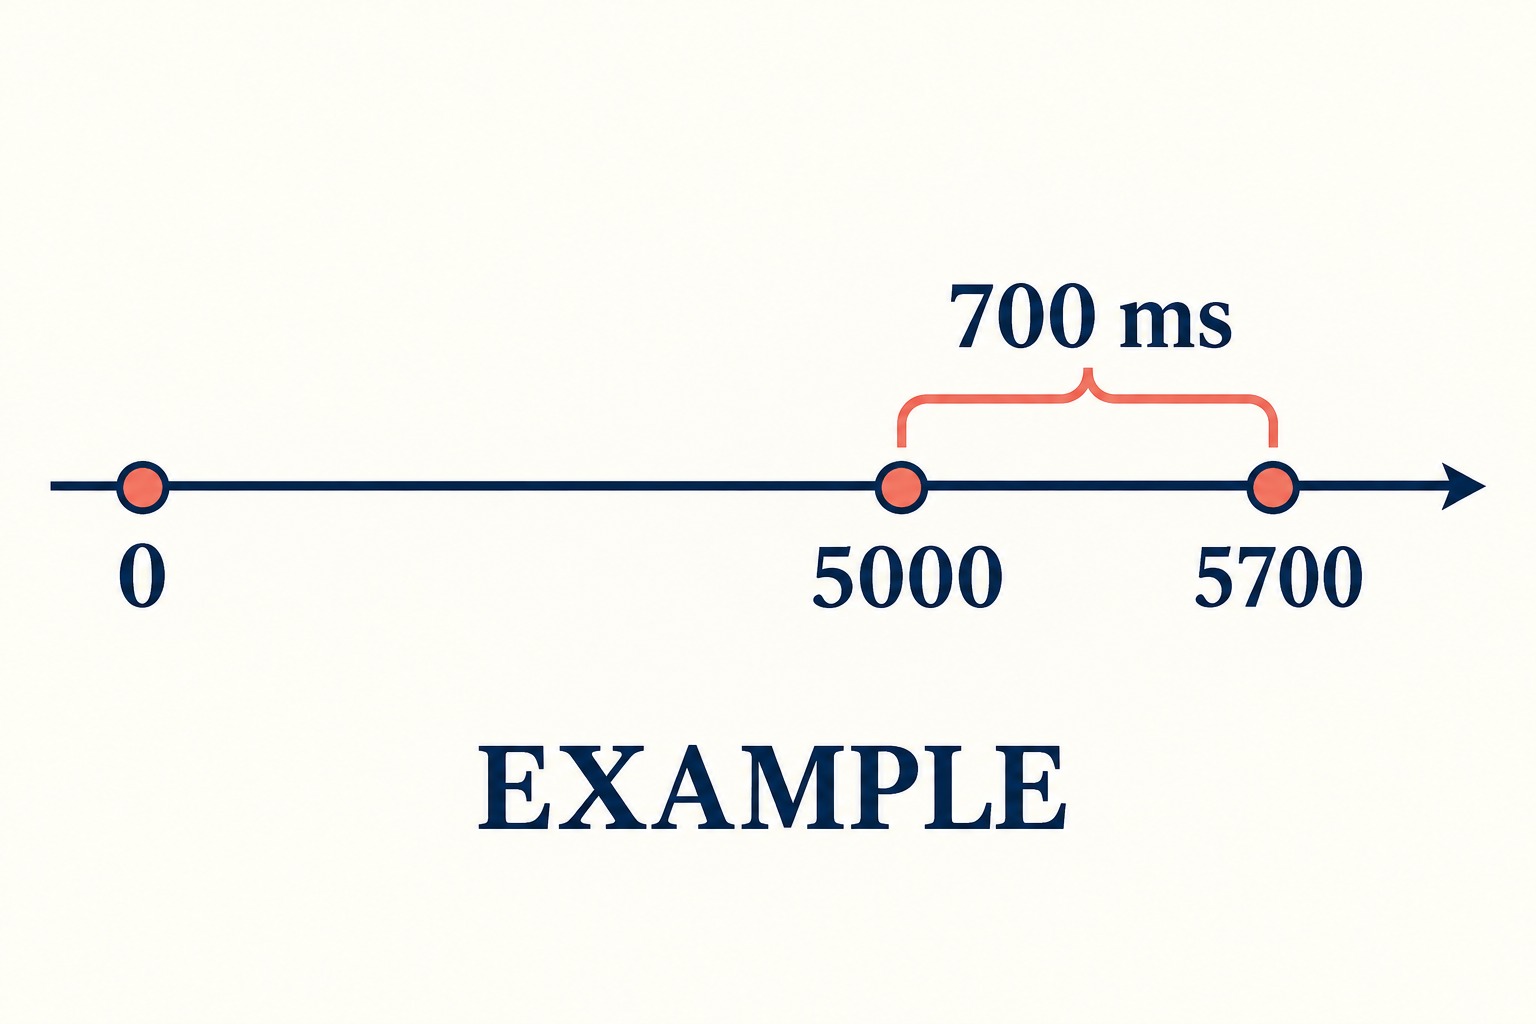
Here is a synthetic arithmetic check: the original document starts at 0 milliseconds; the route-changing interaction starts at 5,000; a correctly associated loading-paint timestamp is 5,700. The difference is 700 milliseconds, not 5,700. This demonstrates the time-origin problem only. It is not a measured LCP result or a performance target.
Triage what the recording actually shows
| Observation | Next useful check | Avoid concluding |
|---|---|---|
| Expected route has no detected marker | Check browser support, the performed action, visible URL change and recording boundaries. Save the reproduction. | “No marker means no waiting.” |
| Direct and in-app results differ | Compare content, cache and the work performed on each path. | “One of the numbers must be wrong.” |
| A local recording improves | Repeat under matched conditions, then plan appropriate real-user validation. | “All customers are now faster.” |
| Runs vary widely | Look for changing data, background work or test settings before averaging. | “The fastest run represents the release.” |
A persistent banner can be eligible for a direct-load paint metric while only newly painted content matters on an in-app transition. Chrome documents this distinction. Record what was measured before comparing the values. Also verify your monitoring provider's soft-navigation support separately; local DevTools visibility does not prove production reporting is configured.
Leave a route receipt for the next reviewer
Copy this compact record into an issue or release note. Leave unknowns as unknowns.
- Task: starting route → action → expected destination content
- Version: app build and browser version
- Conditions: device, viewport, network, CPU, cache and sample-data state
- Evidence: direct-load recording ID; in-app recording ID; repeat-run observations
- Finding: what changed, what stayed comparable and what remains unexplained
- Next step: one fix or one additional observation, with an owner

Review traces for sensitive URLs, screenshots and application data before sharing them. Keep only the evidence the recipient needs. The useful handoff is not “Performance looks green.” It is a route someone else can reproduce, with enough context to know what the numbers actually describe.